Where to Manufacture in 2026? China vs Thailand vs India
For pure labor cost, India is the cheapest of the three, with manufacturing wages often running about half of China's, while Thailand sits in the middle and China remains the most expensive. But in 2026, labor is no longer the number that decides where you manufacture. Tariffs, supply chain depth, and total landed cost now matter just as much, and on those measures the three countries diverge sharply.
This guide breaks down what it actually costs to manufacture in China, Thailand, and India in 2026, across labor, tariffs, supply chains, infrastructure, taxes, and the hidden costs that rarely show up in a first quote. If you are weighing where to place production or diversify your sourcing, this is the full picture.
Why the 2026 Sourcing Decision Is Different
For most of the past decade, sourcing decisions came down to a simple choice: China cost more but delivered unmatched supply chains, while lower-wage countries like India offered savings at the expense of speed and depth.
In 2026, US trade policy has scrambled that logic. In February 2026, the Supreme Court threw out the tariffs that had been set country by country, which ranged from about 10% to nearly 50% depending on where goods came from. In their place, a single flat surcharge of 10% now applies to most imports, no matter which country they come from. At the same time, China continues to face a stack of additional tariffs that no other country carries. The result is that trade access, not just wages, now drives the true cost of manufacturing, and it can change quarter to quarter.
With that context, here is how the three countries compare.
Labor Costs
Labor is usually the largest variable cost in manufacturing, and it is where these three countries separate most clearly.
China is now the most expensive of the three. Manufacturing wages generally run between $6 and $8 per hour depending on region and skill, well above where they sat a decade ago, and mandatory social contributions such as pensions and medical insurance add another 30% to 40% on top of base pay. China's average annual manufacturing wage reached about 108,000 yuan in 2024 and is projected to keep climbing toward 115,000 yuan by 2026. Wages have more than doubled over the past ten years, and China's absolute labor cost advantage has been steadily shrinking.
Thailand occupies the middle tier. Manufacturing labor typically runs in the range of roughly $3 to $5 per hour, lower than China but higher than India, with statutory contributions adding to the total. Thailand's workforce is experienced, particularly in automotive and electronics, though productivity and automation still trail China.
India offers the lowest labor costs of the three. Manufacturing wages in comparable sectors often sit at about half of China's or less, making India especially attractive for labor-intensive production like textiles, apparel, and assembly. India also brings a large, young, English-speaking workforce, which eases communication and quality coordination. The trade-offs are wage inflation in some regions and productivity that varies widely by state and sector.
The takeaway: for labor-intensive goods where wages dominate the cost sheet, India wins on paper. But labor is only one line item, and the others increasingly tip the balance.
Tariffs and Trade Access
This is the section that matters most in 2026, and it is where the three countries look least alike.
China carries a tariff burden no other country faces. On top of the standard duties, Chinese goods are subject to Section 301 tariffs (commonly 7.5% to 25%), Section 232 tariffs on metals, and the Section 122 surcharge, and these can stack. For steel and aluminum, stacked rates can climb above 65% before standard duties are even applied. Certain categories go far higher: electric vehicles from China face effective rates above 100%, and solar cells and modules exceed 50%. For many US importers, these tariffs now outweigh China's manufacturing efficiencies.
Thailand benefits from the 2026 reset. After the Supreme Court struck down the reciprocal tariffs, Thailand, which had faced steep surcharges, now generally pays the flat 10% Section 122 baseline, a dramatic improvement over its earlier position. This has made Thailand a popular China-alternative, though it comes with a caveat below.
India sits in a more uncertain spot. Like other Asian nations, India moved toward the flat 10% baseline for many goods after the February 2026 ruling, but India-specific tariff negotiations have been ongoing, with elevated country rates at times reaching as high as 50% and trade talks continuing into 2026. For India, the tariff outlook is a live variable rather than a settled number.
It is also important to consider each country's import duties on components. India has historically imposed relatively high import tariffs, averaging around 18% on many components. This increases production costs for manufacturers that rely on imported parts. China, by comparison, has maintained average import tariffs of roughly 7%. Thailand also holds an advantage through its ASEAN and RCEP trade agreements, which reduce tariffs on regional imports.
A critical warning for 2026: the flat 10% advantage that Thailand and India enjoy may not last, and it is worth understanding why.
The first reason is policy. In March 2026, the US Trade Representative opened Section 301 investigations into Vietnam, India, Thailand, and dozens of other countries. If those investigations lead to action, new tariffs on these nations could arrive before the year ends, erasing much of their current edge.
The second reason is enforcement. Authorities are cracking down on transshipment, the practice of routing Chinese goods through a third country to disguise their origin and dodge tariffs. Because of this, moving only final assembly to a lower-tariff country, without genuine local manufacturing, now carries real compliance risk.
Put together, these two forces point to one conclusion: today's tariff rates are a moving target. Any sourcing decision built on them alone should be tested against the strong chance that they change.
Because rates shift frequently and vary by product, always verify the current duty for your specific HTS classification before committing. For a broader strategy, our guide on how to diversify suppliers walks through practical steps.
Supply Chain and Raw Materials
Access to materials and components directly shapes lead times and total cost, and here the ranking differs again.
China remains dominant. Decades of investment have produced the densest supplier clusters in the world across electronics, textiles, auto components, and precision materials. Vertical integration and local sourcing mean a Chinese factory can often obtain a needed component within the same industrial zone, cutting lead times and cost in ways competitors struggle to match. For complex electronics and precision goods, this depth is still China's single biggest advantage.
Thailand has strong, focused supply chains, especially in automotive, electronics, appliances, and furniture. It is a mature manufacturing base for these sectors, though for components outside its core strengths, manufacturers often still import from China.
India is strongest in textiles, apparel, packaging, pharmaceuticals, chemicals, and a growing auto-parts sector. Its domestic supply chains are developing quickly, supported by government initiatives, but for advanced electronics and precision components India still relies on imports, which can add cost and lead time.
Infrastructure and Logistics
Getting goods made and shipped on time depends on ports, roads, power, and logistics networks.
China offers top-tier infrastructure, with world-class ports, highways, rail, and industrial parks that keep production and export moving efficiently. This reliability is a major reason it has retained manufacturing despite higher wages.
Thailand provides dependable infrastructure well suited to mid-scale operations, with solid ports and logistics, particularly around its automotive and electronics corridors.
India has historically lagged on infrastructure but is closing the gap fast through large national programs like PM Gati Shakti, aimed at integrating transport and logistics. Quality still varies by region, with some industrial states far ahead of others, so location within India matters a great deal.
The difference shows up clearly in logistics spending. In China, logistics costs run just 8 to 10% of GDP, a sign of how efficient its networks are. In India, that figure sits higher at 13 to 14%, driven by slower ports, customs delays, and fragmented industrial zoning, though initiatives like new Special Economic Zones aim to close the gap. Thailand falls in between, with sound regional logistics anchored by ports like Laem Chabang.
Corporate Tax and Incentives
Tax rates and government incentives affect the bottom line beyond production costs.
China applies a standard corporate income tax rate of 25%, with reduced rates available for qualifying high-tech and encouraged industries.
Thailand offers a headline corporate tax rate of 20%, and its Board of Investment (BOI) provides generous incentives, including multi-year tax holidays, for targeted industries under its Thailand 4.0 strategy.
India has a standard corporate rate of around 22% for existing companies, and notably offers a concessional rate near 15% for newly incorporated manufacturing firms, alongside Production Linked Incentive (PLI) schemes designed to attract manufacturers in electronics, pharmaceuticals, and other priority sectors under the Make in India banner.
For a new manufacturing entity, India's incentive structure and Thailand's BOI packages can meaningfully lower the effective tax burden below China's.
Utilities and Energy
Energy is a significant cost in many manufacturing processes.
China generally provides relatively affordable and highly reliable industrial electricity, backed by enormous generating capacity.
Thailand offers stable power at moderate cost, sufficient for reliable mid-scale manufacturing.
India has improved its power reliability considerably, though industrial electricity costs and occasional supply variability still differ by state, so energy-intensive manufacturers should evaluate specific locations carefully.
Productivity and Quality
Low wages mean little if productivity or quality lags, so total output per dollar matters.
China leads on productivity, supported by advanced automation, mature training systems, and low error rates. A higher wage often buys more output per hour and fewer defects.
Thailand delivers moderate, dependable productivity, especially in its established automotive and electronics sectors, though automation levels trail China.
India shows the widest range. Top-tier Indian manufacturers rival global standards, while others require closer oversight and supplier development. The upside is a large, capable, English-speaking workforce that responds well to training and quality programs.
The Costs That Don't Show Up in a Quote
What a supplier quotes and what you actually pay are two different things. Several costs surface only after production begins, and they can reshape the comparison entirely.
Total landed cost
Once tariffs, freight, insurance, and duties are added, a "cheaper" country can end up more expensive at the dock. In 2026, tariffs alone can swing this by double digits.
Quality failures and rework
Defects, rejects, and rework erase savings fast, which is why supplier auditing and inspection are essential in lower-cost markets.
Lead time and inventory
The longer or less predictable your shipping times, the more backup stock you have to keep on hand, which ties up cash you could use elsewhere.
Minimum order quantities
Supplier MOQs and tooling costs vary widely and affect smaller buyers disproportionately.
Compliance and transshipment risk
With tariff enforcement tightening in 2026, misjudging country-of-origin rules can trigger penalties that dwarf any unit-cost savings.
Managing from a distance
Coordinating across time zones, languages, and quality standards takes real time and effort, even though it never appears on an invoice.
Strengths by Sector
The right country often depends on what you make. In textiles and apparel, India excels in cotton-based production at low wages, China is automating toward higher-value garments, and Thailand produces quality mid-tier apparel for ASEAN markets. In electronics and automotive, China dominates with full vertical ecosystems, Thailand is a key automotive assembly hub, and India is scaling fast, now producing devices like Google Pixel phones and Apple AirPods under its incentive schemes. In heavy industry, China holds a cost edge in energy-intensive sectors like steel.
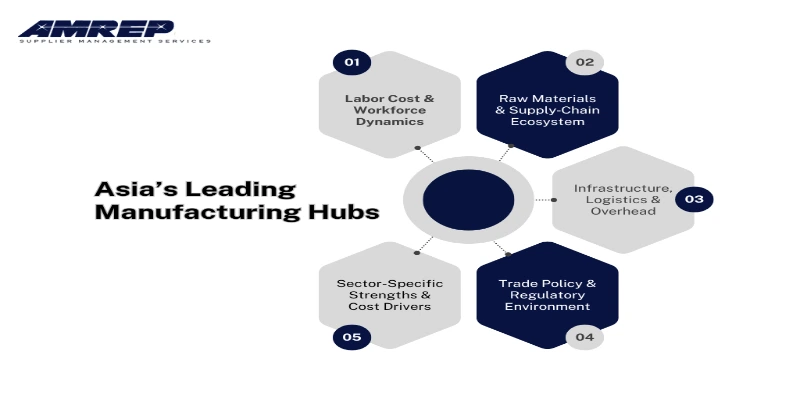
China vs. Thailand vs. India: Manufacturing Costs, Capabilities & Risks Compared
Use this quick reference to see how China, Thailand, and India compare across every major cost and capability.
| Factor | China | Thailand | India |
|---|---|---|---|
| Labor cost | Highest (~$6 to $8/hr) | Middle (~$3 to $5/hr) | Lowest (about half of China) |
| 2026 US tariff exposure | Highest (Section 301, 232, 122 can stack) | Low (flat ~10% baseline) | Variable (baseline to elevated, in flux) |
| Supply chain depth | Deepest (electronics, precision) | Strong in autos, electronics, furniture | Strong in textiles, pharma, chemicals |
| Infrastructure | Top-tier | Reliable, mid-scale | Improving fast, varies by region |
| Corporate tax | 25% | 20% (plus BOI incentives) | ~22%, or ~15% for new manufacturers |
| Productivity | Highest | Moderate | Wide range |
| Best for | Complex, high-volume, precision goods | Automotive, electronics, appliances | Labor-intensive goods, textiles, pharma |
Where You Should Manufacture, and Why
There is no single winner. The right choice depends on your product, volume, and tolerance for risk.
Choose China when supply chain depth, precision, speed, and high-volume capability outweigh tariff exposure, particularly for complex electronics and products that depend on components only China's ecosystem can supply quickly. Just budget carefully for tariffs.
Choose Thailand when you want a favorable 2026 tariff position, reliable mid-scale infrastructure, and strength in automotive, electronics, appliances, or furniture. It is a strong balance of cost, quality, and trade access this year.
Choose India when labor is your dominant cost, your product suits its strengths in textiles, apparel, pharmaceuticals, or chemicals, and you can take advantage of manufacturing incentives. Watch the tariff negotiations, and choose your state carefully for infrastructure and power.
Many companies are landing on a "China plus one" strategy, keeping China for what it does best while shifting other production to Thailand, India, or elsewhere to spread tariff and geopolitical risk. For many US importers, that "elsewhere" increasingly means nearshoring, and our guide on Why Mexico is the top alternative to China explains why.
This shift is not only about avoiding tariffs. Companies are also pursuing what analysts call "friend-shoring," which means moving production to stable, low-cost countries like India and Thailand to build long-term resilience, even if tariffs ease later.
Each country is responding in its own way. India is loosening labor laws, building new industrial zones, and investing heavily in semiconductors, with a goal of capturing 5% of global manufacturing by 2030. China, meanwhile, is using its "Made in China 2025" strategy to move up the value chain, shifting from low-cost assembly toward robotics, smart manufacturing, and advanced technology.
Plan Smarter in 2026 with AMREP Mexico
In 2026, the cheapest wage no longer means the lowest cost. India still leads on labor and suits cost-focused, labor-intensive production. China remains a powerhouse for integrated supply chains, automation, and complex high-tech goods, though its tariff burden weighs heavier than ever. Thailand offers a balanced mid-tier option this year, with a favorable tariff position and strong ASEAN integration.
But as this guide has shown, the right choice depends on far more than a single number. Tariffs shift quarter to quarter, quality failures erase savings fast, and total landed cost is what truly separates a smart sourcing decision from an expensive one. That is exactly where the right partner makes the difference.
At AMREP Mexico, we help businesses cut sourcing risk and strengthen supply chain performance with expert on-ground support, supplier verification, and quality control solutions, so you can manufacture smarter, closer, and with confidence, wherever you produce.